The Back Page · Actual FootyThe 50 Funnel · Round 19 · 2026
The Back Page presents
THE LAST LINK
Sydney 71 · Adelaide 87 · Round 19 · the SCG
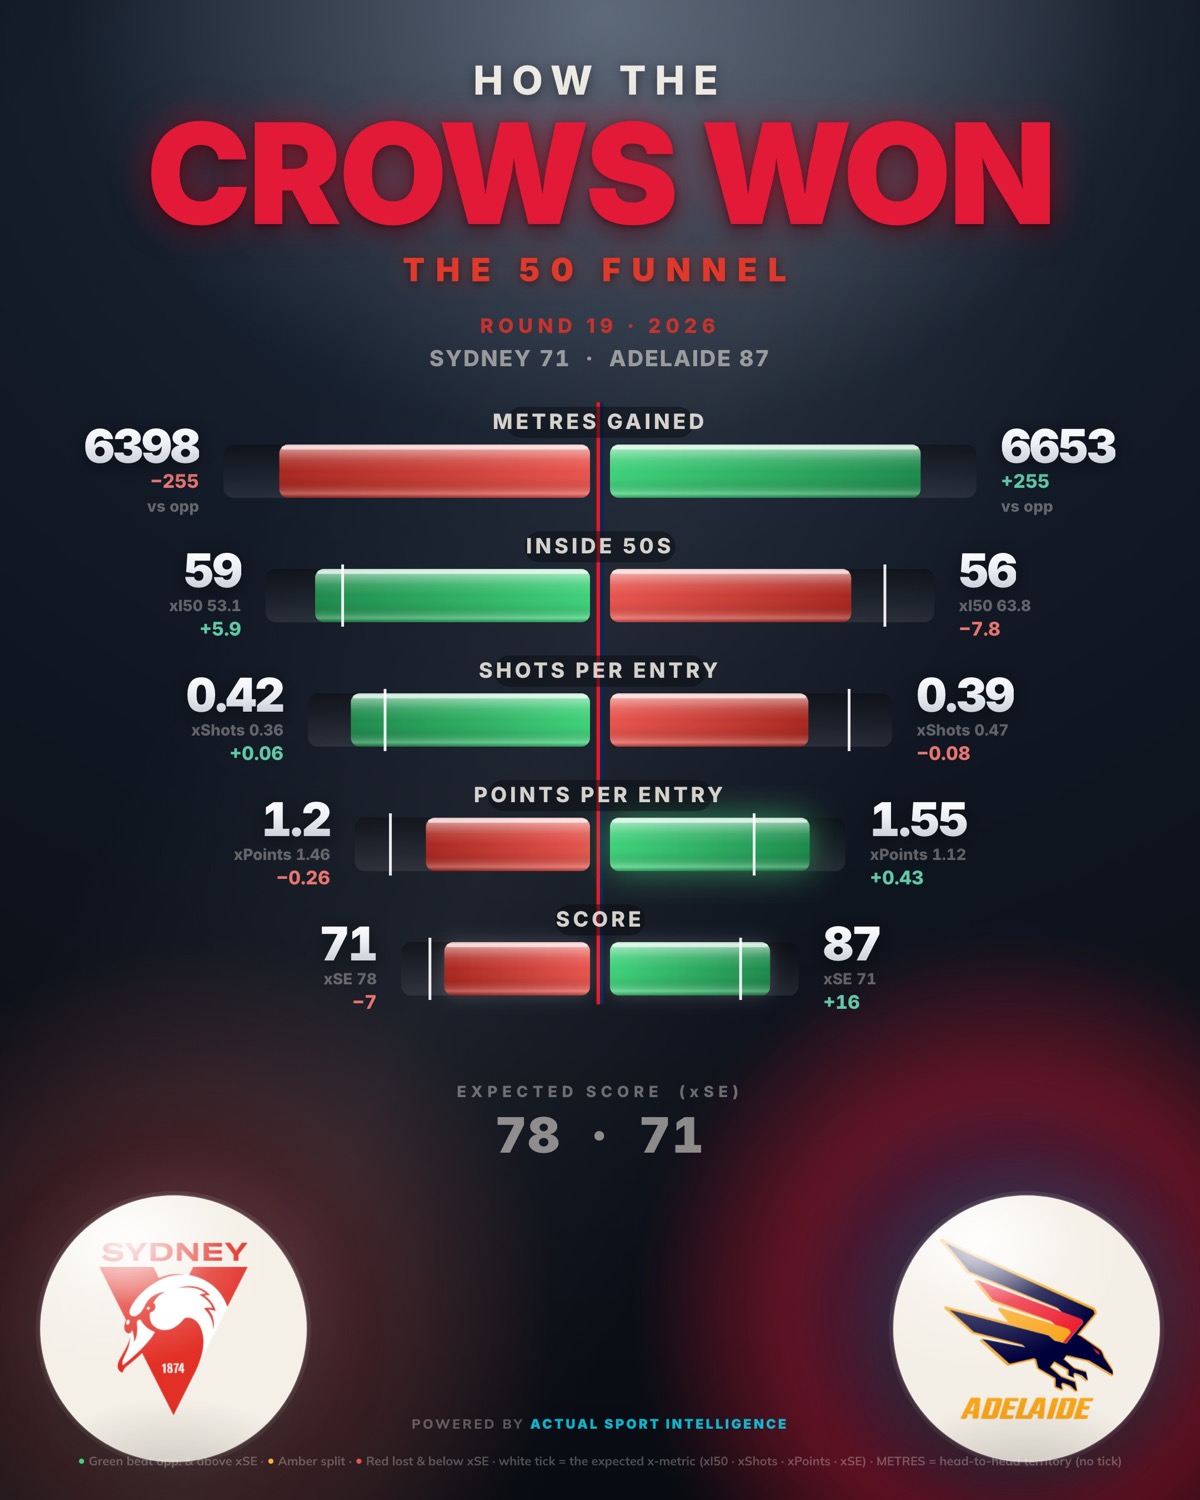
Sydney went inside 50 more often and got more shots from every entry — and lost by 16. The 50 Funnel shows exactly where a game like this is decided: the last link.
What each side's football was worth on the day — and what it actually put on the board.
Sydney
71
worth 78 · −7
Adelaide
87
worth 71 · +16
Sydney earned more than they scored · Adelaide scored more than they earned
Who won each part of the game
Split the game into its four jobs. Adelaide won all four — but the two on the right are the ones that turn football into score.
ADVANCE
Territory & forward movement
SYD 0.98ADE 1.64
Adelaide
CONVERT
Chances into points
SYD 0.49ADE 0.92
Adelaide
CONTROL
The contested ball
SYD 0.46ADE 1.58
Adelaide
DISRUPT
Pressure & turnovers
SYD 1.29ADE 2.08
Adelaide
Inside 50s
59–56
Sydney went in more
Shots per entry
0.42–0.39
Sydney created more
Points per entry
1.20–1.55
Adelaide finished more
Adelaide's finish
+18%
above their own season
The 50 Funnel · every link in the chainSydney v Adelaide · R19
Read top to bottom. Sydney win the first rungs — territory, entries, shots. Adelaide win the two that pay: points per entry, and the scoreboard.
Where the game turned
Sydney won the build. They lost the finish — and the funnel shows the exact rung it happened on.
Sydney won the build. 59 inside 50s to 56 — six more than their own football usually manufactures — and more shots from each visit forward. Across the front of the chain, this was Sydney's game.
Adelaide won the only rung that pays. 1.55 points from every entry to Sydney's 1.20 — almost 30% more scoreboard from each trip inside 50. Same chain, opposite ends.
The finish did it, not the field. Adelaide scored 18% more per shot than their own season average — against the one defence in the competition that concedes the least per shot. The visitor's single best weapon, landing on the host's single best strength.
Both scoreboards misread the game. Sydney's football was worth 78 and paid 71; Adelaide's was worth 71 and paid 87. The team that earned more is the team that lost.
Sydney didn't lose the territory. They lost the last kick of the chain — the one link the funnel is built to expose.
Win these, win the game
The stats that decide matches, and who won each one here. The bar is the win signal — how often the side that wins that stat wins the game. Adelaide led seven of these eight; Sydney only the first entry count.
The numberSydney · AdelaideWin signal
ADVMetres gained
6398SYD · ADE6653
100%
CONVScore per inside 50
1.20SYD · ADE1.55
99%
ADVMarks inside 50
4.0SYD · ADE10.0
97%
CTRLContested possessions
149SYD · ADE166
85%
CONVScore per shot
2.84SYD · ADE3.95
82%
CTRLForward-50 ground balls
0.39SYD · ADE0.61
81%
ADVClean ball use
64.6SYD · ADE69.7
81%
ADVInside 50s
59SYD · ADE56
89%
Win signal = how often, historically, the side that wins this stat wins the match · higher is better on every row shown
A great game, or a great role — rarely both
Every player on the ground, placed by two things: how much they lifted their team's winning shape (up) and how well they did their own job (right). The best sit top-right. The story of the day is the red dot sitting highest of all — on the side that lost.
SydneyAdelaide
The best player afield — Papley — sits near the very top: he lifted Sydney's winning shape as much as anyone on the ground, and they still lost. Milera drove Adelaide's win; Mills did his job best of all.
The contest · unit against its own season formRound 19
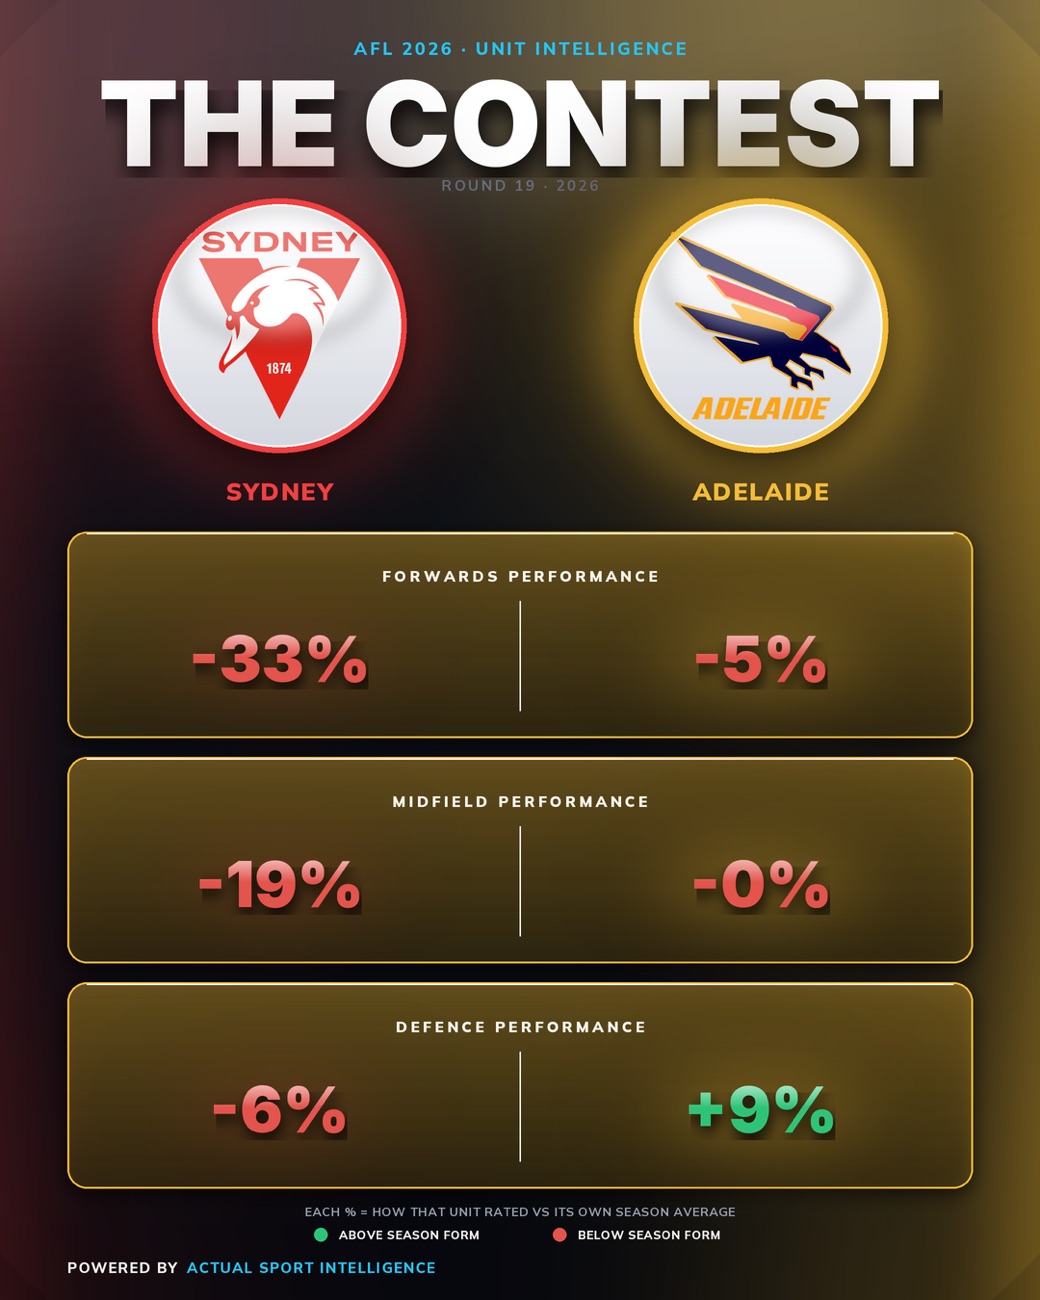
Every number is a unit measured against its own season. One room on the ground played above its standard — Adelaide's defence.
Three rooms, one above the line
Sydney's forward line played a third below its own standard; their midfield a fifth below. Adelaide's defence was the only room on the ground above its season form — nine per cent up — and it is the room the win came out of.
The finishing gap wasn't luck; it was starvation. Sydney are the best marking-inside-50 side in the competition, and Hayden McLean — a key forward — did not take a single mark inside 50. Charlie Curnow kicked five the week before and none here, because the ball stopped arriving where he lives. Sydney's forwards were left to scrap for the second-most ground balls any forward line has managed all season. That is not a strength on the stat sheet. It is what a forward line is forced into when nothing sticks.
Earned, or flattered
Every side's supply compared with what it actually scored. Sydney made more football than they cashed. Adelaide cashed more than they made.
Sydney · wasted supply
Made more than they scored
More entries and more shots than their day was worth — and 7 points light on the scoreboard for it.
supply+5.9output−6.8
Adelaide · finished hot
Scored more than they made
Fewer entries than their day was worth — and 16 points over on the scoreboard anyway. Goals over on thin supply.
supply−7.8output+15.7
Best on ground · contribution above season formRound 19
The best player afield wore red and white — and finished on the losing side.
Tom Papley took ten shots at goal — nearly three times his season, one of the biggest days any medium forward has had all year — and it wasn't enough. Wayne Milera drove the win the other way, twelve marks out of Adelaide's back half against a season of five. Best on ground is no consolation when the game is decided one link further down the chain.
The form that walked in
Neither side arrived cold. One was climbing, one was sliding — and the game continued both trends.
Adelaide · away
▲ Surging · 3 wins running
Arrived pulling away from what the model expected — the margin trend climbing across the run. This result continued it.
Sydney · home
▼ Sliding · 2 losses running
Arrived with the scoreboard swinging back to meet expectation, the season margin sliding for weeks. This result continued it.
What the evidence carries
The easy read — ten-goals-eleven at home, Sydney wasted it — needs the finishing gap to be chance. It wasn't. Sydney built the better game and lost it at the last link, against the one side in the league built to win exactly there. For the second week running, Sydney's finish paid them short of what their football earned; Adelaide's, for the second week running, paid them over.
What that means from here is yours to weigh. What the evidence carries is narrower, and firmer: the better-built game and the winning game were not the same game.